Less water, fewer weeds? What an Oregon tall fescue experiment measured
An Oregon study compares irrigation amounts and frequency in tall fescue. Understand lawn color, annual bluegrass results and the limits before changing your schedule.
The water that helps the lawn can also help its competitors
When unwanted plants appear in a lawn, the first question is often which product to use. An earlier question is what conditions maintenance creates. Irrigation changes the environment shared by the plants we want and those we would rather contain.
A field experiment from Oregon State University offers measurements for this discussion. Its appeal is the comparison between separate goals: maintaining lawn color, using water and limiting weed establishment. The same watering decision need not optimize all three.
The paper at a glance
| Item | What to know |
|---|---|
| Paper | Kowalewski et al. (2025). DOI: 10.1002/its2.184 |
| Question | How do irrigation amount and frequency affect tall fescue color and weeds? |
| Trial | Corvallis, 2021–2022; Thunderstruck cultivar, silty clay loam; four replicates. |
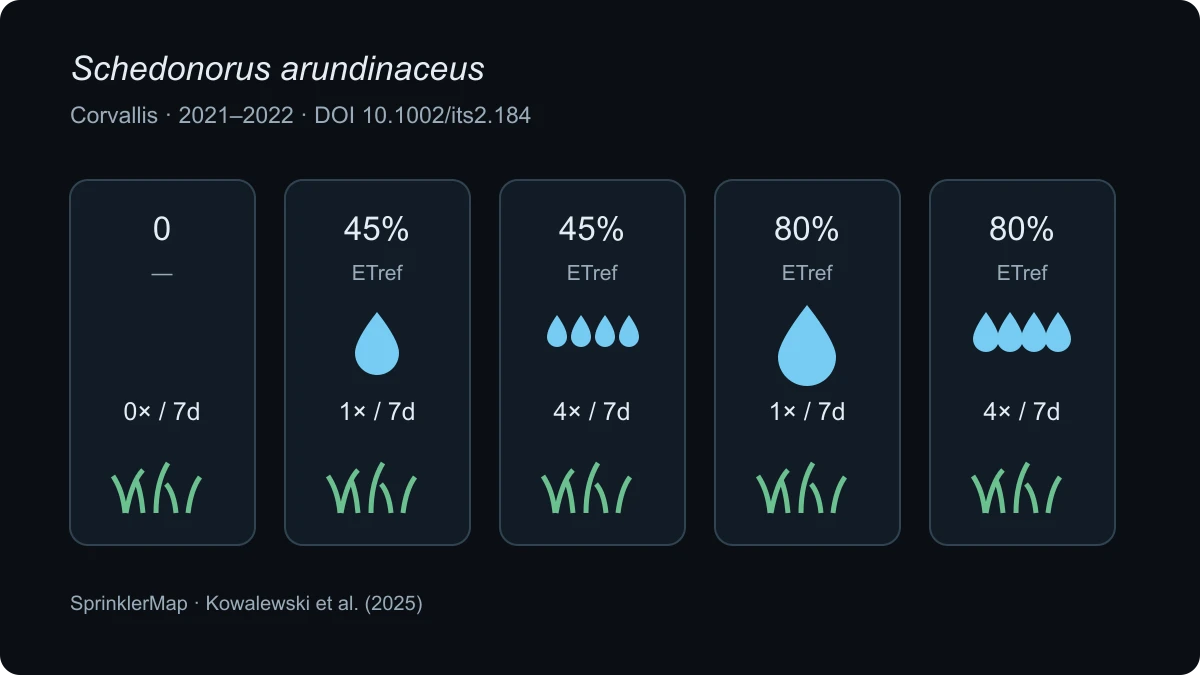
| Treatments | 45% and 80% reference ET replacement, once or four times weekly; an unirrigated control. |
| Measurements | Color, soil moisture and weed cover. |
| Tradeoff | Less annual bluegrass in the control, but loss of color at peak summer stress. |
Amount and frequency are different controls
Amount answers how much water; frequency answers how that amount is divided over time. Imagine applying 20 mm weekly: one 20 mm event and four 5 mm events deliver the same volume but different wetting and drying sequences. This is our arithmetic example, not a dose recommended by the paper.
One millimeter equals one liter per square meter: 20 mm over 100 m² is 2,000 liters. For US readers, those dimensions are approximately 0.79 inches and 1,076 square feet. Run time depends on application rate: 5 mm takes 30 minutes at 10 mm/h, or 15 minutes at 20 mm/h. Importing weekly starts without knowing water depth leaves half the question unanswered.
ET means water transferred from soil and plants to the atmosphere. Reference ET is a baseline, not a meter reading on your lawn. This experiment used Kimberly–Penman; it was not a direct test of the FAO-56 equation. The connection with Why Evapotranspiration Is the Foundation of Modern Irrigation: the FAO-56 Paper Explained is reasoning in water depth instead of fixed minutes.
How to read a lawn experiment
Replicates help distinguish treatment effects from the peculiarities of one patch of soil. Color is rated on a declared scale; weed cover measures occupied surface area. A seasonal average and the hottest week answer different questions: an acceptable average can conceal a difficult period.
A statistically detectable difference is not necessarily dramatic to the eye. Read statistical evidence alongside effect size, variability and measurement period. Color is not a complete health certificate either: appearance, survival, traffic tolerance and recovery are separate outcomes. Do not attribute unmeasured outcomes to the trial.
Weed results: check the denominator
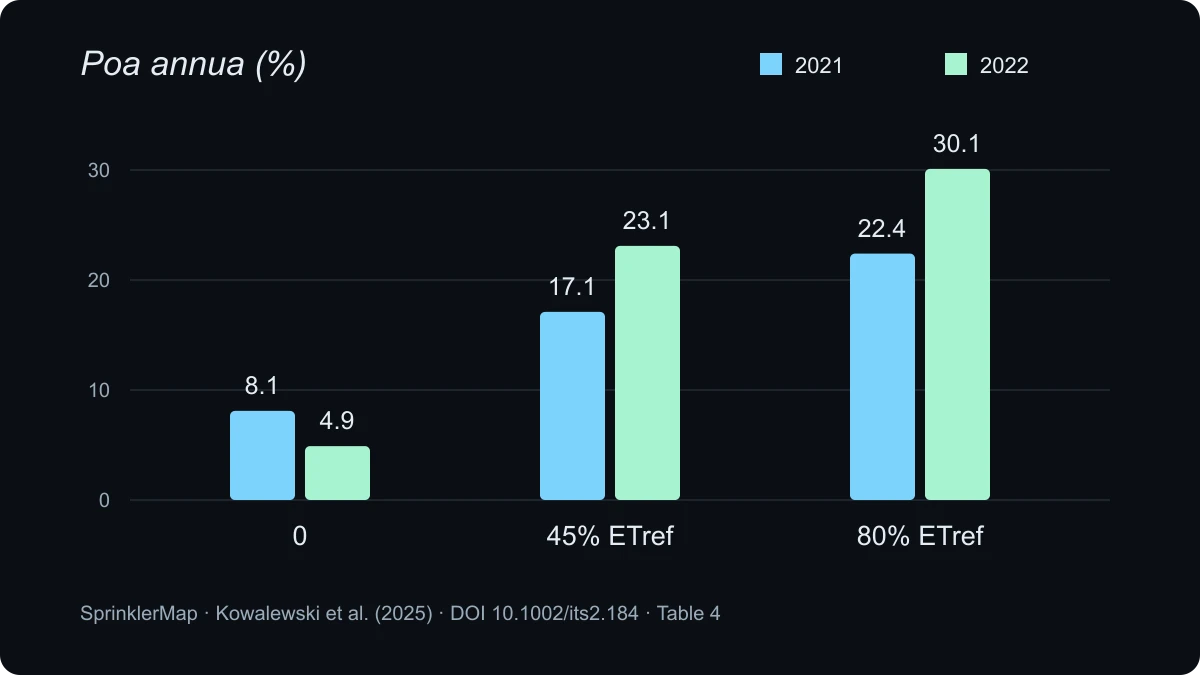
These Table 4 values pool summer observation dates and replicates. The clearest separation is between the control and irrigated treatments. They do not imply that halving your existing schedule halves all weeds. Poa annua, or annual bluegrass, is one species, not a collective name for unwanted plants.
Percentage points and relative percentages are different. Going from 30% to 20% cover is ten percentage points less, or a relative reduction of about one third. Naming the denominator prevents a weed chart from being read as water saved.
| Mean annual bluegrass cover | 2021 | 2022 |
|---|---|---|
| Unirrigated control | 8.1% | 4.9% |
| 45% ETref, frequencies pooled | 17.1% | 23.1% |
| 80% ETref, frequencies pooled | 22.4% | 30.1% |
Color: a mean does not describe every week
The paper rates color from 1 to 9; 6 is the minimum acceptable rating. Irrigated treatments maintained good mean color, with 80% scoring higher than 45%. Frequency affected color detectably only in the second year, and the difference was small: the result is not an absolute rule for weekly starts.
The control dropped below acceptable color in August, then regained color in autumn. The weed result belongs alongside this aesthetic cost: less water does not mean the same appearance every week of the year.
Three details that change the interpretation
Soil is a reservoir. Earlier rain can contribute to later availability. Turning off a controller on a lawn entering summer with little stored water does not recreate a control in another climate.
Volumetric water content is the fraction of soil volume occupied by water, not a generic wetness score. Interpret a sensor for its soil and calibration; copying an online threshold is insufficient.
Irrigation also belongs to a maintenance system involving mowing, fertilization and weed management. Knowing the accompanying practices helps identify the system to which a result belongs.
- No irrigation does not mean no rainfall or no water already stored in the soil.
- Moisture thresholds differed between the younger lawn and the following year: approximately 18% and 9% at the same site.
- A broadleaf herbicide was applied between seasons; the management trial was not entirely herbicide-free.
What to take into your own yard
Verify a decision before making it a habit. Record species or blend, lawn age, exposure, rain and applied depth. When changing a schedule, document color and weed cover in the same areas, turning impressions into a readable comparison.
The maritime Pacific Northwest, arid Southwest and humid eastern US present different conditions. Before reducing water, check whether dry patches are caused by blocked nozzles or uneven coverage: The catch-cup test: measure sprinkler uniformity and your real inches per hour. Otherwise agronomic and hydraulic causes remain confused.
Keep establishment watering separate from maintaining an established lawn; see Watering new grass seed: how many minutes per zone, really. The study invites observation of competing objectives, not a home protocol for deliberately stressing grass or a substitute for identifying weeds.
How this connects to SprinklerMap
SprinklerMap helps draw zones, place sprinklers and evaluate coverage, flow and pressure. Seasonal vegetation and exposure estimates provide a design starting point. It does not predict weeds or derive an automatic tall fescue threshold from the paper.
First check where water is delivered, then consider how much and when. Open the tool from the menu and compare the plan with field measurements. The Rain Bird bodies named in the methods were experimental equipment, not proof that a brand controls weeds.
References
Kowalewski, A., McDonald, B., Wang, R., Schmid, C., Braithwaite, E., Stock, T. (2025). Irrigation rates and frequency affect tall fescue color and weed encroachment. International Turfgrass Society Research Journal, 15, 349–357. DOI: 10.1002/its2.184.
Methods: section 2; numerical comparisons: Table 4; moisture thresholds and limitations: sections 3.2 and 4. Unit conversions and reading guidance are original SprinklerMap editorial explanations.
Frequently asked questions
Can I stop watering my lawn based on this study?
No. The unirrigated control had less annual bluegrass but lost color at peak summer stress. The result belongs to the moderate climate, soil and tall fescue tested in western Oregon.
Does 45% mean cutting my current run times by 55%?
No: it is a fraction of a weather reference adjusted for rainfall, rather than a fraction of an existing schedule. Local requirements and actual sprinkler output come first.
Can I copy the moisture thresholds to my sensor?
Not directly. Volumetric water content depends on soil, depth, instrument and soil contact. A household sensor percentage may not match the measurements in this experiment.
Technical note: An accessible reading and commentary on Kowalewski et al. (2025), DOI 10.1002/its2.184. One cultivar, one site and two summers do not establish universal irrigation thresholds. Illustrations are original SprinklerMap graphics, not trial photographs or reproduced paper figures.