The two water simulations: how much water arrives, and how fast
Two readings of the same system: the dose that reaches the ground and the speed at which it arrives. What each one shows, how to read the colour map, and what changes when you change soil, planting or nozzle.
SprinklerMap Team · 16 agosto 2026
Why two simulations and not one
An irrigation system can fail in two completely different ways, and the two failures are not visible with the same instrument:
- Getting the amount wrong. An area receives less water than the plant consumes and turns yellow. Or it receives too much, and the excess ends up below the roots, where it is no use to anyone.
- Getting the rate wrong. The total amount is right, but it arrives faster than the soil can absorb it. Water stays on the surface, puddles and runs off: the correct dose was delivered, but much of it never entered the soil.
These are independent properties. A system can be perfect on dose and disastrous on rate, or the other way round. That is why SprinklerMap has not one simulation but two: Water Coverage answers the first question, Runoff Risk the second.
One calculation grid, two readings
The two simulations are not separate models that could contradict each other. Both start from the same calculation grid: the garden is divided into cells, and for each cell a single physical quantity is computed — the application rate, how many millimetres of water per hour reach that point while the sprinklers are running, summing the contribution of every sprinkler that reaches it.
From that one number, per cell, both maps follow:
- Water Coverage multiplies it by the irrigation runtime to get the dose in millimetres, and compares that with the estimated need of the planting.
- Runoff Risk compares it with the soil's infiltration rate and works out how much water is left on the surface.
The practical consequence: the two maps cannot say incompatible things about the same system, because the same numbers sit underneath them. The Areas panel — runtime, flow, application rate, number of cycles — reads the same grid.
Cells with no water are shown, not hidden: an area no sprinkler reaches stays grey on both maps. It is the easiest mistake to miss when looking only at the drawn coverage arcs.
Water Coverage: the amount of water against the need
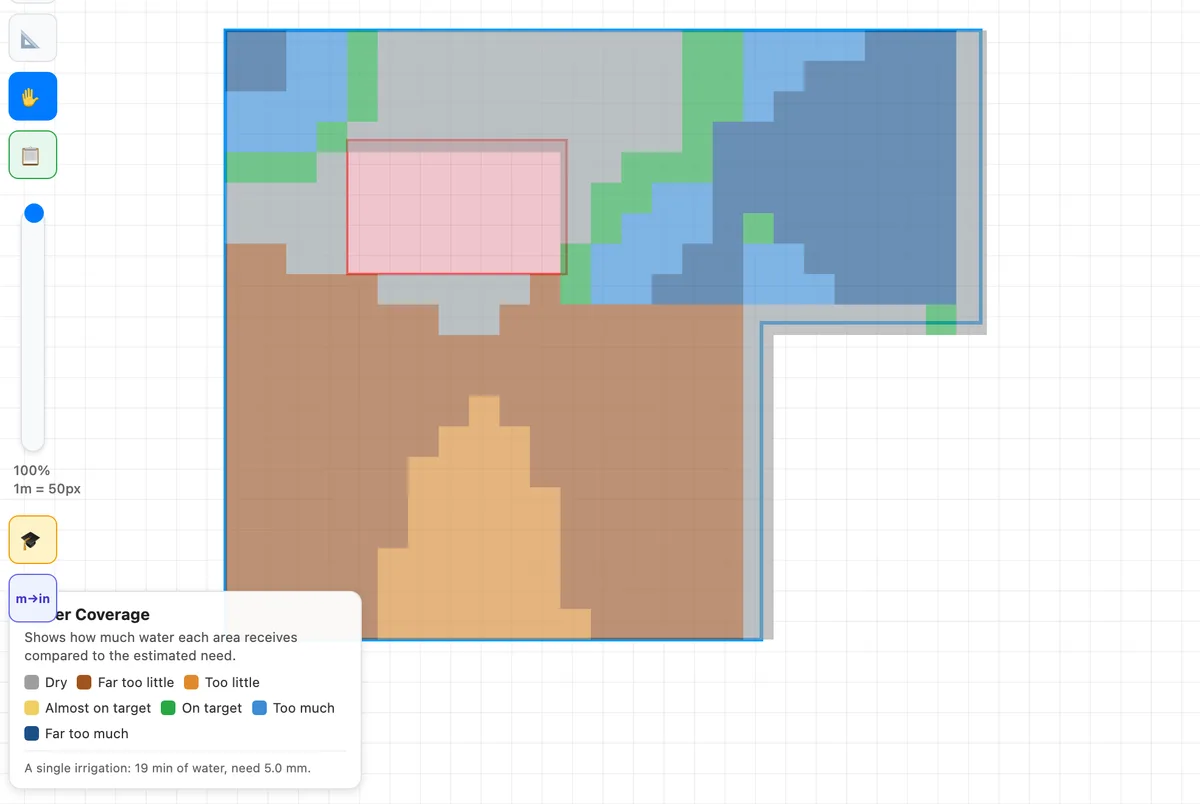
Water Coverage shows how the dose builds up over time — the animation is elapsed time — and colours each area by the ratio between the water received and what the planting needs.
How to read the scale
| Colour | Dose received | Meaning |
|---|---|---|
| Grey | None | Dry area: no sprinkler reaches it |
| Red / orange | Below 90% of the need | Too little water: the planting goes into stress |
| Green | Between 90% and 140% | On target: this is the band to aim for |
| Yellow / brown | Above 140% | Too much water: waste and percolation below the roots |
The green band is a range, not a single value: from 90% to 140% of the need. Demanding exactly 100% everywhere makes no sense — no real system distributes perfectly evenly, and a moderate excess margin is normal design tolerance.
On the test garden (English lawn, full sun, loam soil) the estimated need is 5.0 mm per day, met by a 19-minute cycle with a system flow of 26.4 L/min.
Runoff Risk: the rate against soil absorption
Runoff Risk answers a different question: can the soil keep up with the spray? It compares the water left on the surface with what the soil can hold before it starts running off.
The model, in full
Every soil type has two agronomic parameters: the infiltration rate (how many mm/h it can absorb) and the surface storage (how many mm it can hold on the surface without running off). Water beyond the infiltration rate accumulates:
excess [mm] = (application rate − infiltration) × minutes / 60
As long as the excess stays below surface storage, the water has time to soak in and nothing happens. Once it exceeds it, runoff begins.
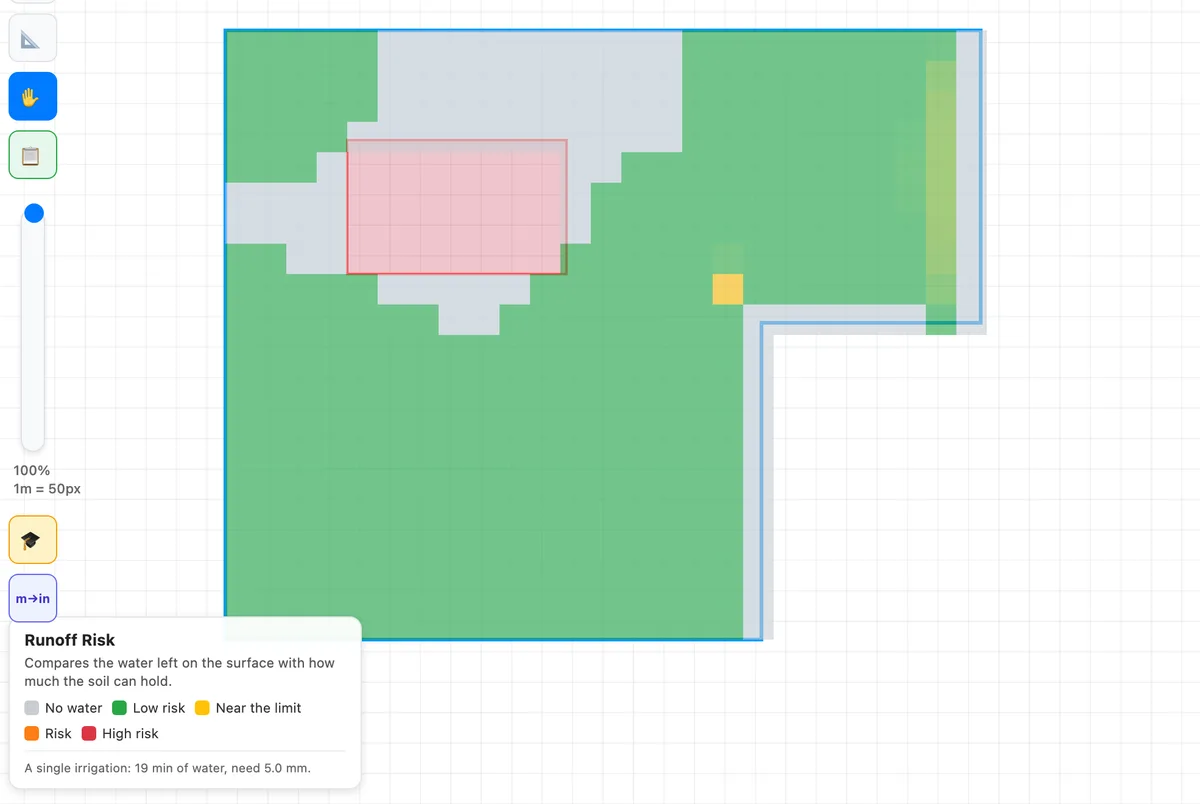
On the test garden: the measured application rate is 22.2 mm/h, and the infiltration rate of loam soil is 25 mm/h. The rate is lower than infiltration, so the excess is zero: the panel reports 0.0 mm left on the surface of the 5 the soil can hold. The map is green almost everywhere.
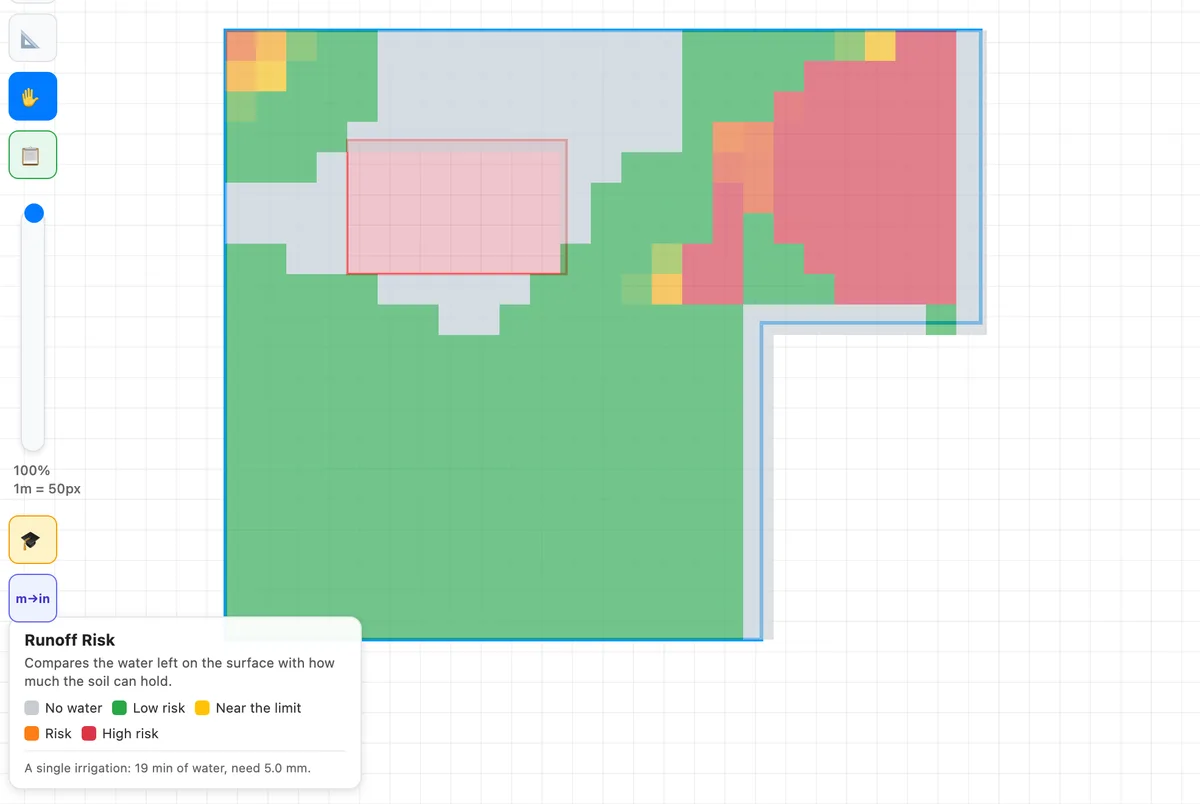
The red that still appears in places is exactly why the map is needed and the panel average is not enough: average rate is not local rate. Where two or three throws overlap, that cell receives the sum of the contributions and can exceed infiltration even when the garden average looks comfortable.
What changes when you change the soil
Soil type is set in the Areas panel and touches neither the sprinklers nor their layout: it only changes how fast the ground absorbs. These are the three values the app uses:
| Soil | Infiltration | Surface storage | Behaviour |
|---|---|---|---|
| Sandy | 50 mm/h | 8 mm | Absorbs fast: runoff is rare, the risk is deep percolation instead |
| Loam | 25 mm/h | 5 mm | Middle ground, the default |
| Clay | 12 mm/h | 3 mm | Absorbs slowly: this is where runoff becomes a real problem |
Clay soil does not just worsen the map: it changes the schedule
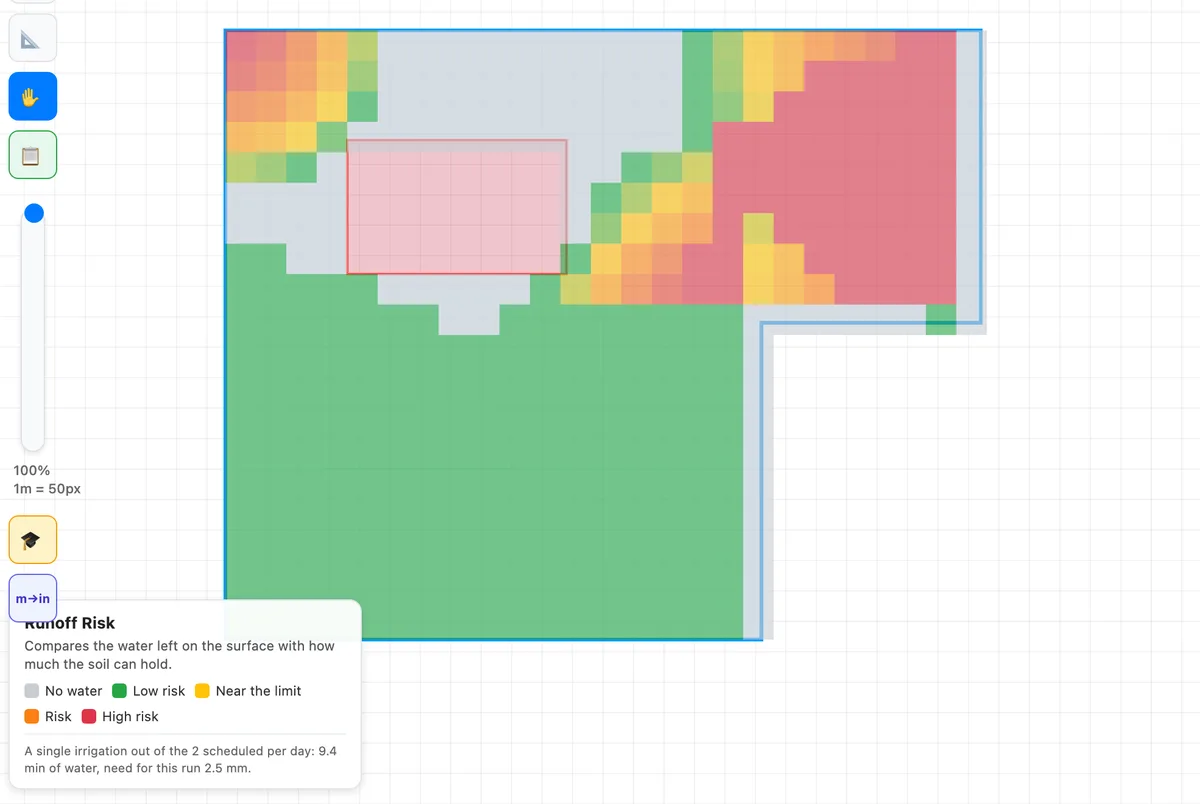
This is the most interesting effect to watch. Switching to clay, the panel stops proposing one 19-minute cycle and proposes 2 of 9.4 minutes instead. This is cycle and soak: the irrigation is split into several runs with a pause between them, so the water has time to soak in from one cycle to the next.
The numbers add up, and can be checked with the formula above:
- As a single run: (22.2 − 12) × 19 / 60 = 3.2 mm of excess, against a surface storage of only 3 mm. It runs off.
- Split into 2 cycles: (22.2 − 12) × 9.4 / 60 = 1.6 mm per cycle, comfortably below 3 mm. It does not run off.
The total amount of water does not change: 2 × 9.4 minutes is the same 19 minutes of water as before, give or take the rounding the panel displays. Only its distribution in time changes. If even splitting cannot get below the threshold, the app leaves the risk warning on rather than pretending an impractical schedule solves the problem.
What changes when you change the planting
Planting does not affect runoff: it changes the need, that is, the target Water Coverage uses to decide which green counts as "on target".
On the same garden with the same 6 sprinklers, switching from English lawn to shrubs and hedging drops the estimated need from 5.0 to 3.0 mm per day, and with it the irrigation runtime from 19 to 11 minutes. Areas that were just below target now fall inside it, because the target has come down.
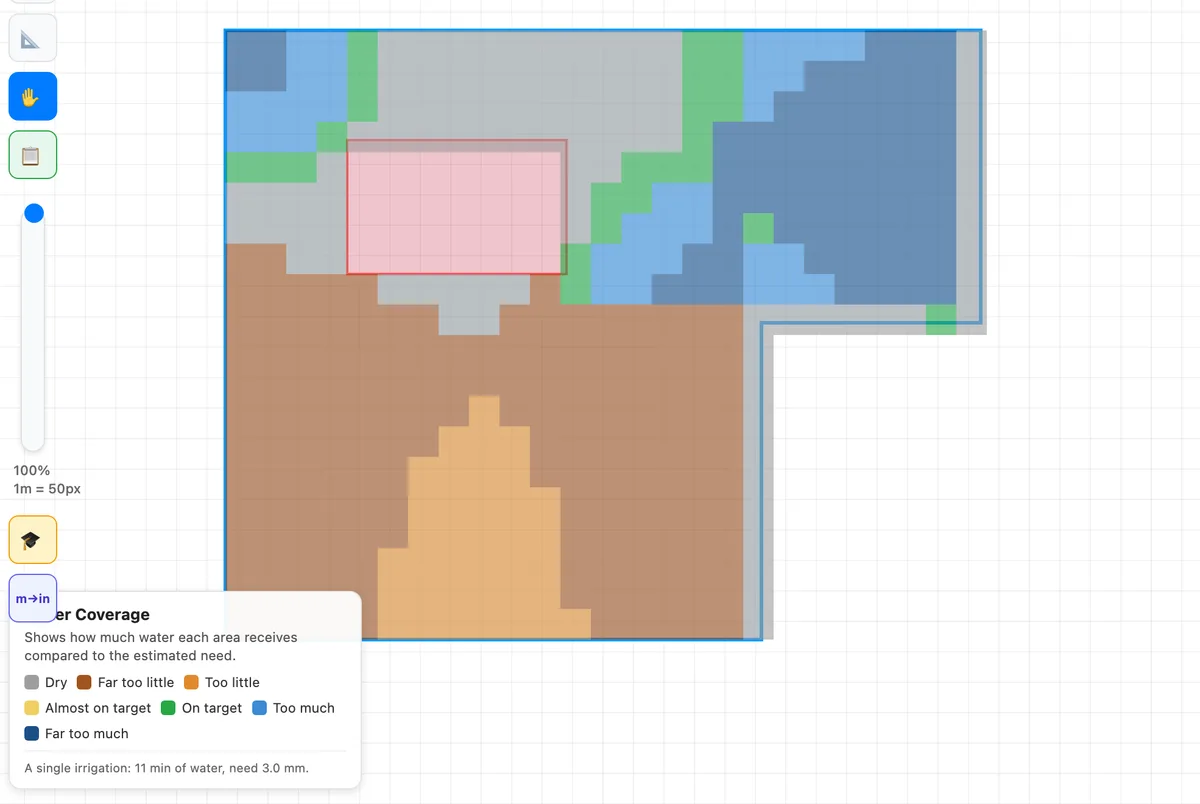
This is the practical reason lawn and shrubs should not share a circuit: they have different targets, and a single runtime cannot hit both. Whatever needs less water ends up watered for as long as whatever needs more.
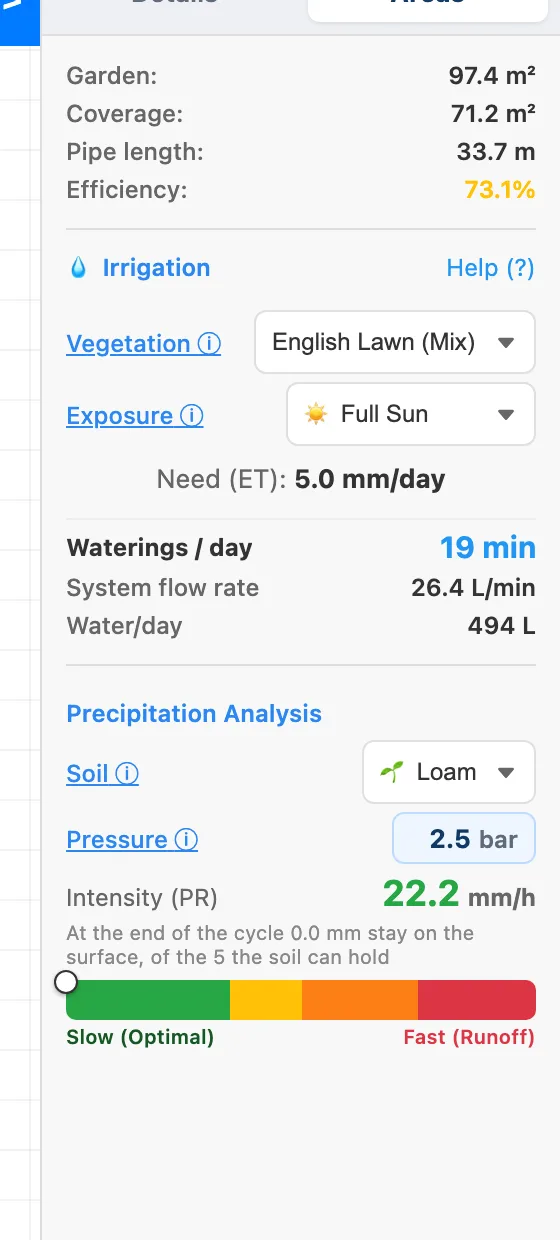
What changes when you change the nozzle type
The last variable is the most underestimated, and it is not in the Areas panel but in the sprinkler list: the nozzle type. A spray discharges all its water in a fixed fan; a rotator spreads it with rotating streams. For the same wetted area, a spray applies far more water per unit of time.
Direct test: same garden, same 6 sprinklers, same positions, same loam soil. Only the nozzle changes, from rotator to spray.
The irrigation runtime collapses from 19 to 9.7 minutes — logically, since delivering the same dose takes about half the time. But the runoff map gets markedly worse: wide orange and red areas appear that were not there with rotators.
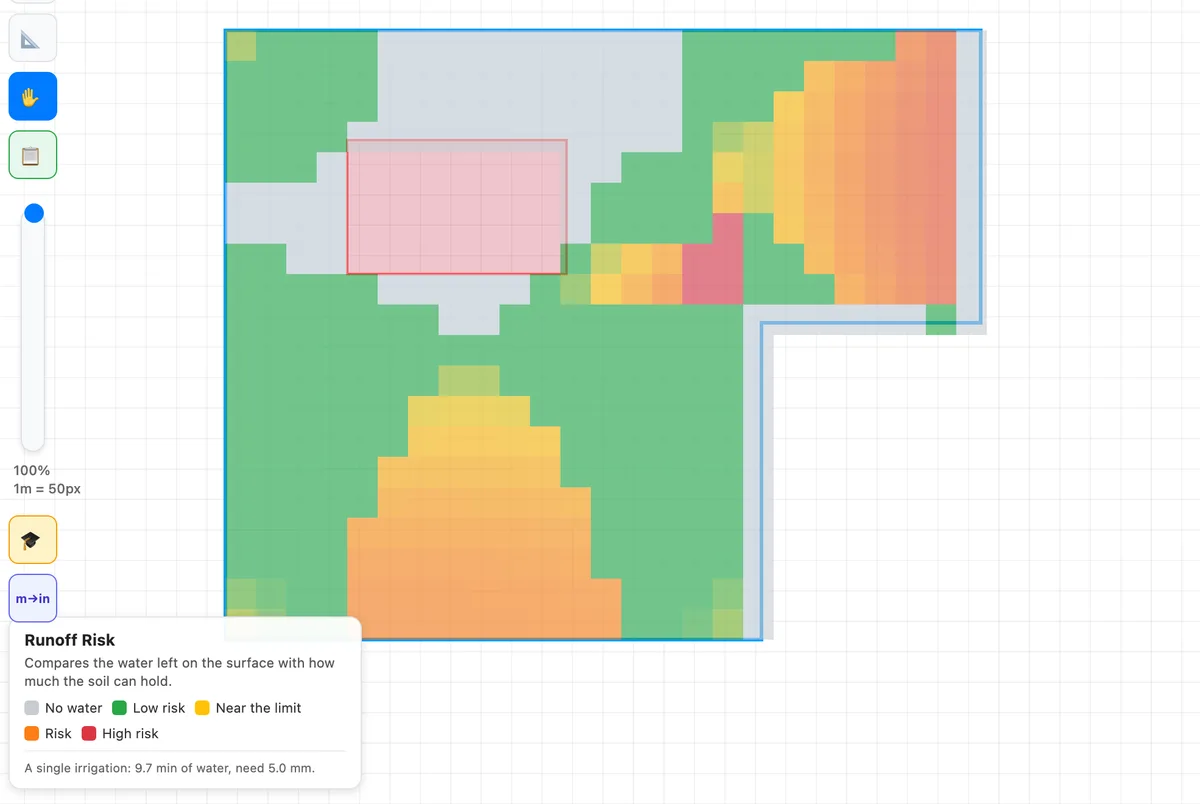
The point is that the same amount of water, delivered faster, is not the same thing. Water Coverage would see the two systems as nearly identical — the dose is the same — while Runoff Risk tells them apart immediately. It is the clearest example of why you need to look at both.
On slow soils, nozzle choice therefore matters as much as layout: with a clay soil at 12 mm/h, a spray-based system almost certainly has to be split into several runs.
How to read the two simulations together
The order that works is this:
- Grey areas first. On both maps grey means "no water". If there are grey areas inside the lawn, the problem is placement and must be fixed there, before looking at anything else.
- Then Water Coverage. Look for widespread green. Red flags areas that will yellow, yellow/brown flags areas where you are wasting water. Fix by moving sprinklers, changing radius or separating hydrozones.
- Finally Runoff Risk. If orange and red appear, the dose is right but arrives too fast. Fix by splitting the irrigation into several runs, moving to low-rate nozzles, or reducing overlap where throws add up.
- Re-read Water Coverage after touching the sprinklers, because every change to the layout also changes the dose.
A system that is ready is green on both maps. Green on only one is not enough.
Stated limits of the simulations
- They do not simulate wind. The distribution model is radial: wind distorts the real throw and moves water, and that effect is not represented.
- They do not account for slope. On ground steeper than 15% surface water runs downhill instead of spreading, and runoff risk is underestimated.
- Soil parameters are typical values for the three classes (sandy, loam, clay). Real soil may be compacted, have an impermeable layer or already be saturated from recent rain — all conditions that reduce effective infiltration.
- The need is a seasonal estimate based on planting and exposure, not a real-time measurement. A controller fed with weather data will always be more precise than any a priori estimate.
- The simulation shows a single run, not the whole irrigation season.
Formulas, parameter sources and the tool's general limits are collected in the calculation methodology. To understand where the sprinkler layout you are simulating comes from: how automatic placement works →
SprinklerMap Team — Irrigation technical guides
Software development, garden design workflows and technical review on realistic residential cases. Our story →